
Introduction:
Docker Container Monitoring Dashboard is one of the most important monitoring solutions for DevOps engineers. By using Prometheus, Grafana, and cAdvisor, you can monitor Docker container performance, CPU utilization, memory consumption, network traffic, and storage usage in real time.
In this guide, we will build a complete Docker Container Monitoring Dashboard using Prometheus and Grafana step by step.
This assignment will help you monitor Docker containers with Prometheus and Grafana.
Learn how to build a Docker Container Monitoring Dashboard using Prometheus, Grafana, and cAdvisor. Monitor Docker container CPU, memory, network, and storage metrics in real time.
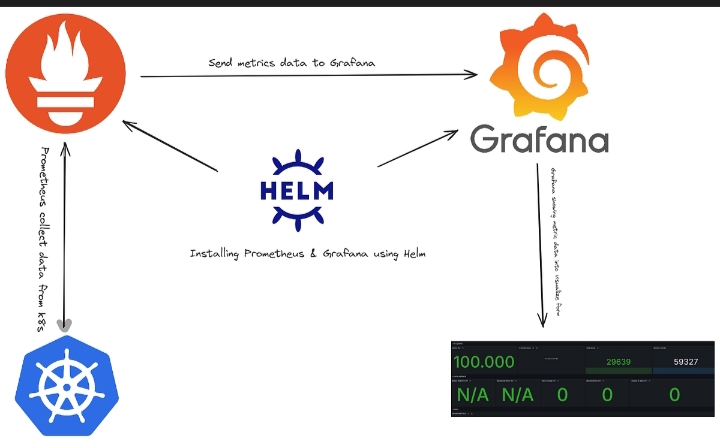
Architecture
Docker Containers
       |
   cAdvisor
       |
  Prometheus
       |
   Grafana
Step 1: Create Monitoring Directory
mkdir docker-monitoring
cd docker-monitoring
Step 2: Create Docker Compose File
vim docker-compose.yml
Add the following content:
version: '3'

services:

  cadvisor:
    image: gcr.io/cadvisor/cadvisor:latest
    container_name: cadvisor
    ports:
      - "8081:8080"
    volumes:
      - /:/rootfs:ro
      - /var/run:/var/run:ro
      - /sys:/sys:ro
      - /var/lib/docker/:/var/lib/docker:ro
    restart: unless-stopped

  prometheus:
    image: prom/prometheus
    container_name: prometheus
    ports:
      - "9090:9090"
    volumes:
      - ./prometheus.yml:/etc/prometheus/prometheus.yml
    restart: unless-stopped

  grafana:
    image: grafana/grafana
    container_name: grafana
    ports:
      - "3000:3000"
    restart: unless-stopped
Step 3: Create Prometheus Configuration
vim prometheus.yml
Add,
global:
  scrape_interval: 15s

scrape_configs:
  - job_name: 'cadvisor'

    static_configs:
      - targets: ['cadvisor:8080']
Step 4: Start Monitoring Stack
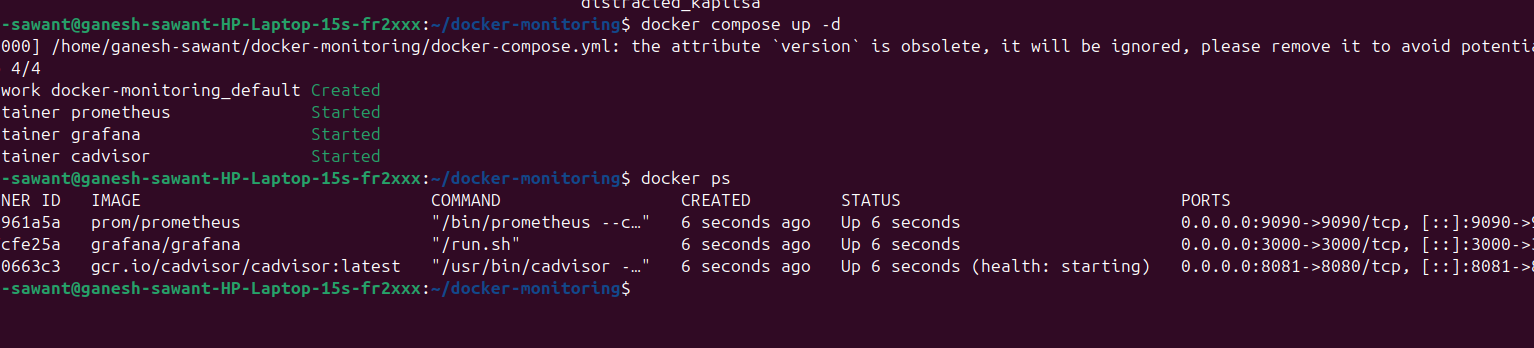
docker-compose up -d
Verify:
docker ps
Step 5: Access cAdvisor
Open:
http://localhost:8081
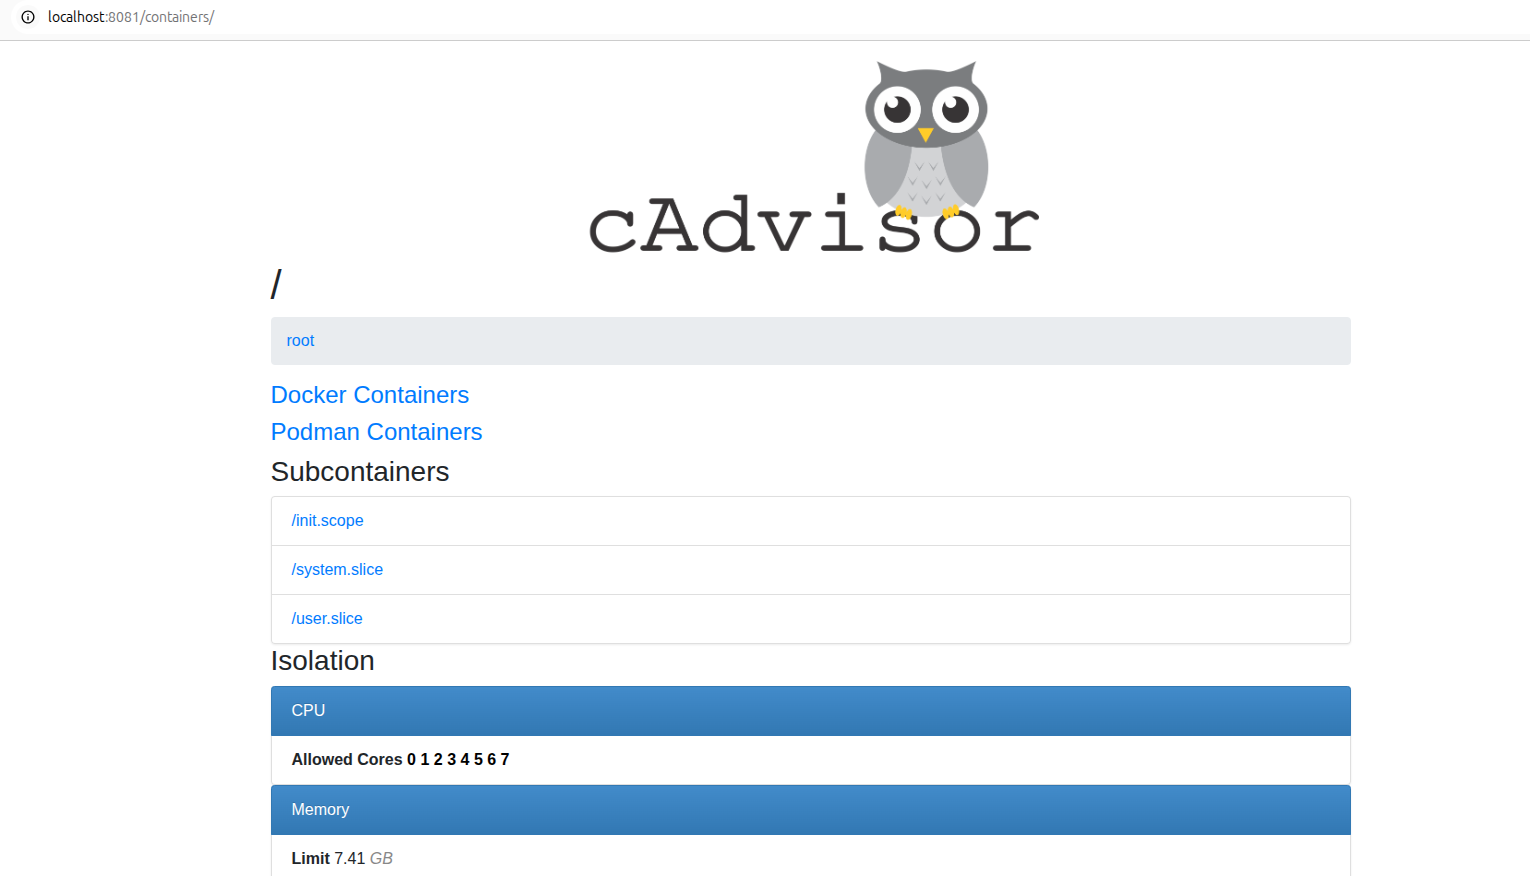
You should see Docker container metrics.
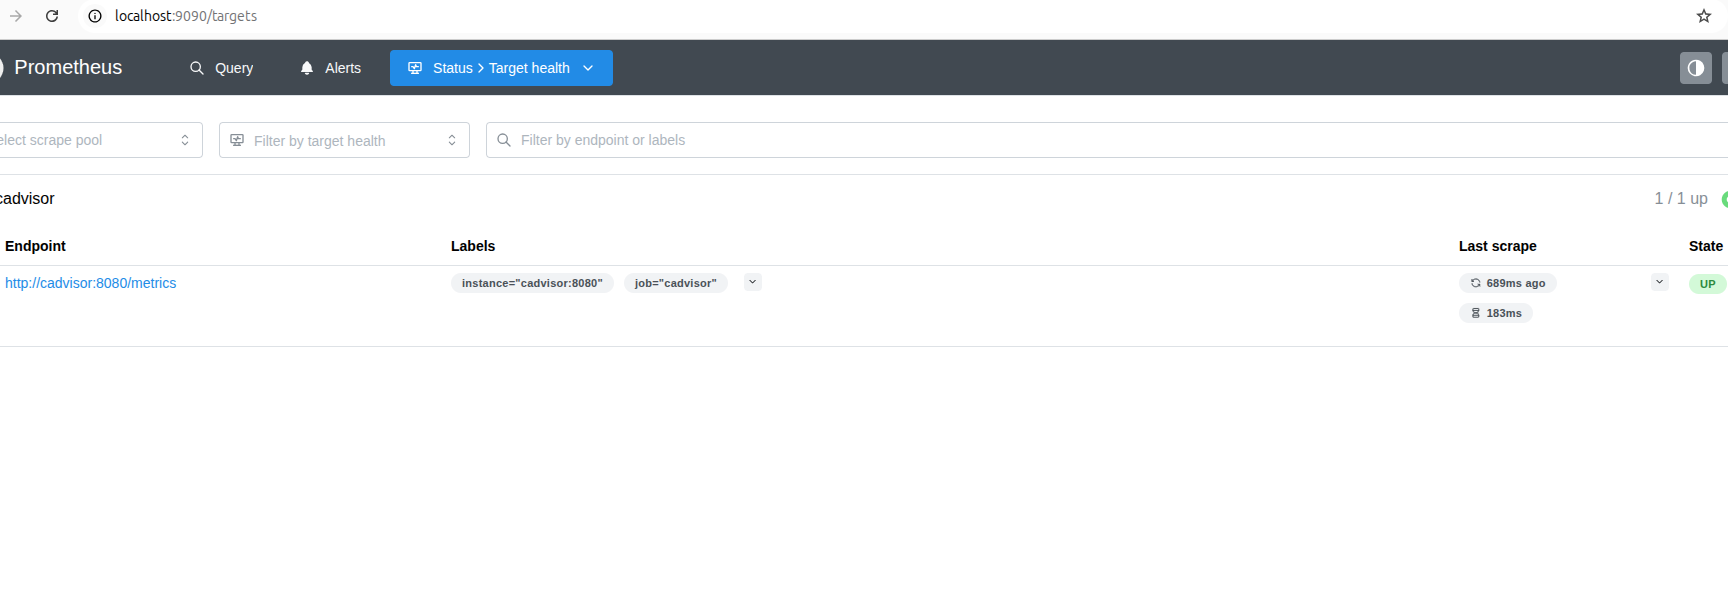
Step 6: Access Prometheus
open,
http://localhost:9090
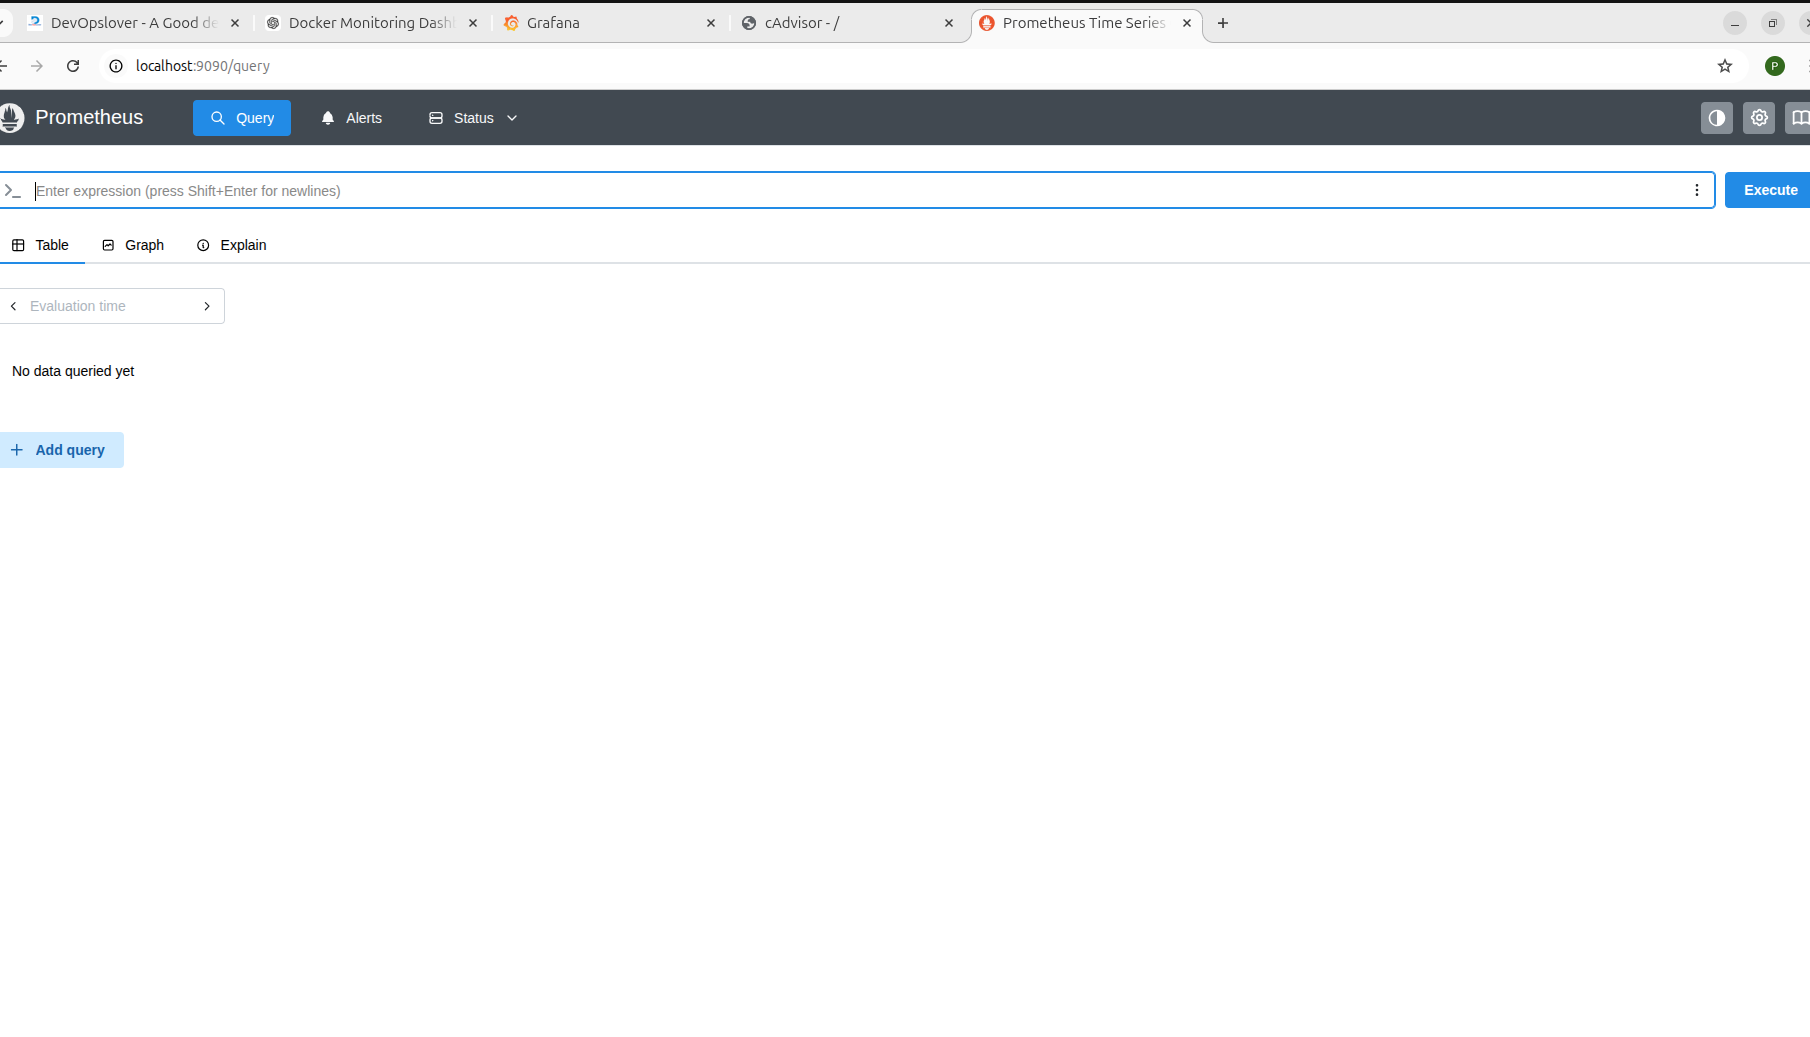
Go to:
Status → Targets
Verify:
cadvisor = UP
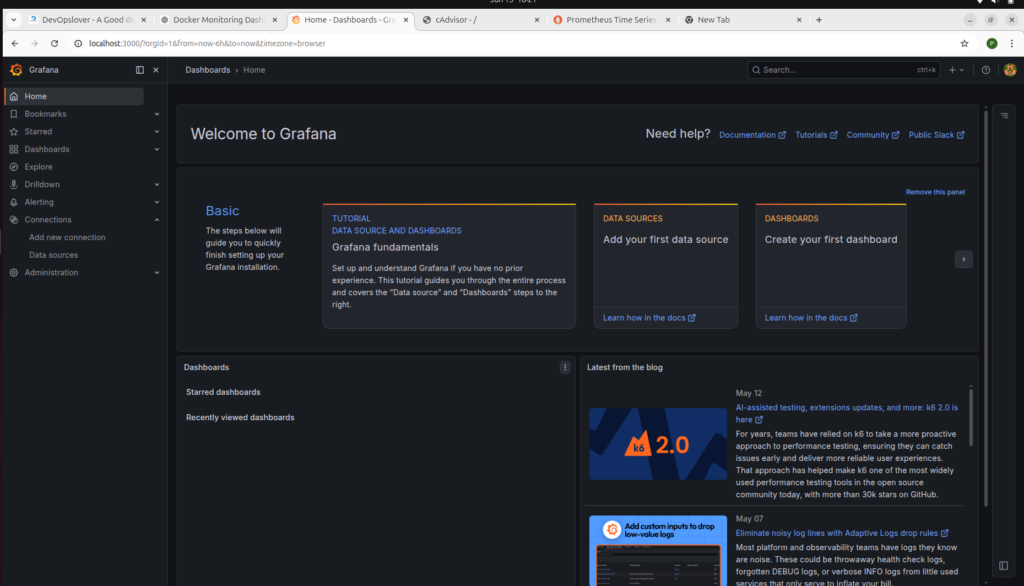
Step 7: Access Grafana
Open:
http://localhost:3000
Default login:
Username: admin
Password: admin
OR set a new password.
Conclusion:
Setting up a Docker Container Monitoring Dashboard using Prometheus, Grafana, and cAdvisor provides a powerful solution for monitoring containerized applications in real time. cAdvisor collects detailed container metrics, Prometheus stores and processes the monitoring data, and Grafana transforms the data into interactive and visually appealing dashboards.
By following this step-by-step guide, you can track CPU usage, memory consumption, network activity, and storage utilization of your Docker containers from a centralized dashboard. This monitoring setup helps DevOps engineers and system administrators quickly identify performance bottlenecks, troubleshoot issues, and ensure the stability of containerized environments.
As your infrastructure grows, you can further enhance this monitoring stack by configuring alerts, integrating Alertmanager, monitoring multiple Docker hosts, and collecting application-specific metrics. Implementing a Docker Container Monitoring Dashboard is an essential step toward building a reliable, scalable, and production-ready monitoring solution.

- Trivy Docker Vulnerability Scanning – Complete Guide - October 14, 2026
- How to Create a Server on AWS – Step-by-Step Guide for Beginners - September 2, 2026
- Helm GitOps Integration: A Complete Step-by-Step Guide for Beginners - August 6, 2026