
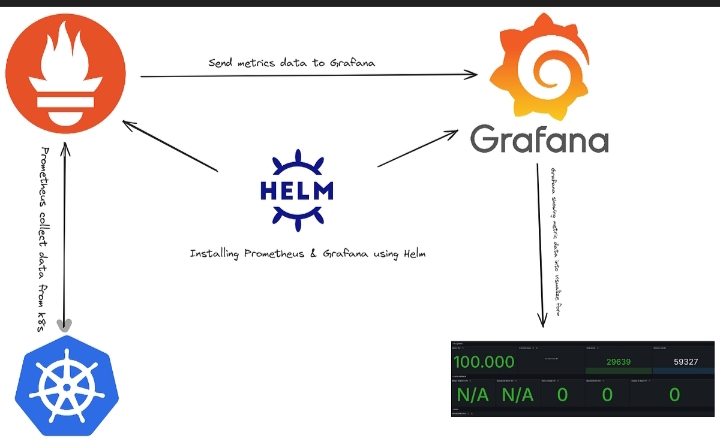
Architecture
+---------------------+
| Kubernetes Cluster |
+----------+----------+
|
v
+---------------------+
| kube-state-metrics |
+---------------------+
|
v
+---------------------+
| Node Exporter |
+---------------------+
|
v
+---------------------+
| Prometheus |
+---------------------+
|
v
+---------------------+
| Grafana Dashboard |
+---------------------+
|
v
+---------------------+
| Email Alerts |
+---------------------+
Introduction:
Kubernetes Cluster Monitoring using Grafana & Prometheus
Kubernetes Cluster Monitoring using Grafana & Prometheus is one of the most effective ways to monitor the health, performance, and resource utilization of Kubernetes clusters. Prometheus collects metrics from Kubernetes components, while Grafana provides interactive dashboards to visualize those metrics in real time. Together, they help DevOps engineers identify performance issues, optimize resource usage, and ensure high availability of applications.
In this step-by-step guide, you will learn how to deploy Prometheus and Grafana using Helm, configure monitoring for your Kubernetes cluster, access Grafana dashboards, and verify that metrics are being collected successfully.
Why Kubernetes Cluster Monitoring using Grafana & Prometheus?
Monitoring is essential for maintaining a healthy Kubernetes environment. Kubernetes Cluster Monitoring using Grafana & Prometheus enables you to monitor CPU usage, memory consumption, pod status, network traffic, storage utilization, and application performance from a single dashboard. This helps teams quickly detect failures, troubleshoot issues, and improve overall cluster reliability.
Prerequisites:
- Ubuntu Server
- Kubernetes Cluster
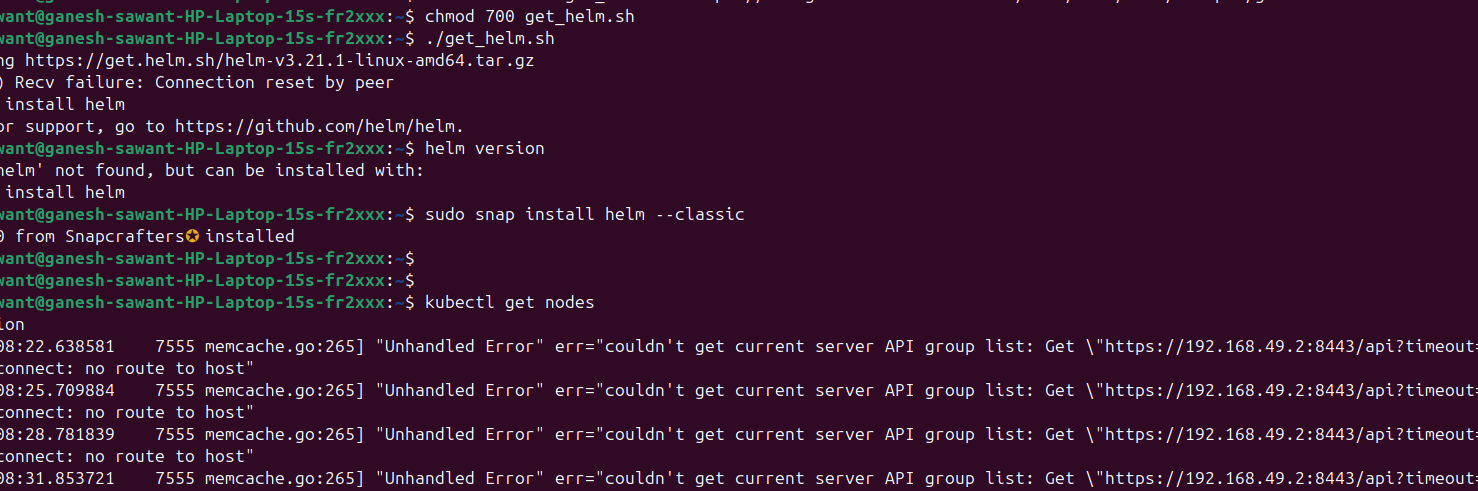
- kubectl configured
- Helm installed
Verify:
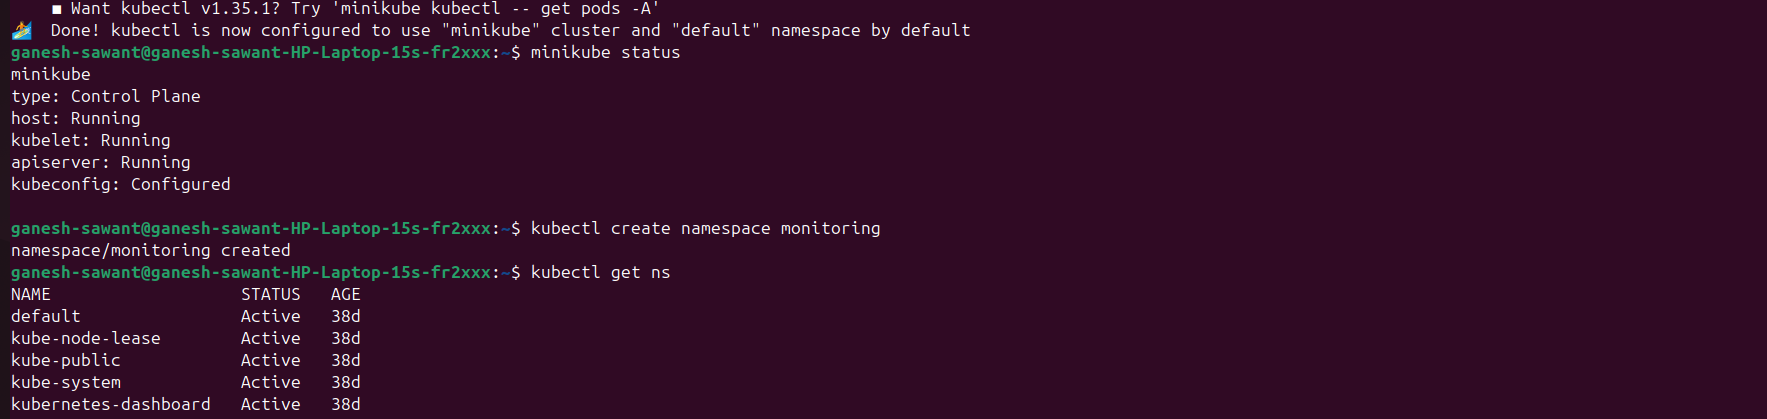
kubectl get nodes
helm version
Install Prometheus for Kubernetes Cluster Monitoring
Step 1: Create Monitoring NamespaceConclusionConclusion
kubectl create namespace monitoring
Verify:
kubectl get ns
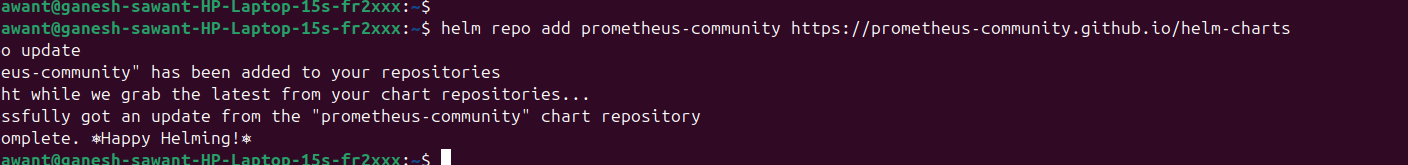
Step 2: Add Helm Repository
helm repo add prometheus-community https://prometheus-community.github.io/helm-charts
helm repo update
Check charts:
helm search repo prometheus-community
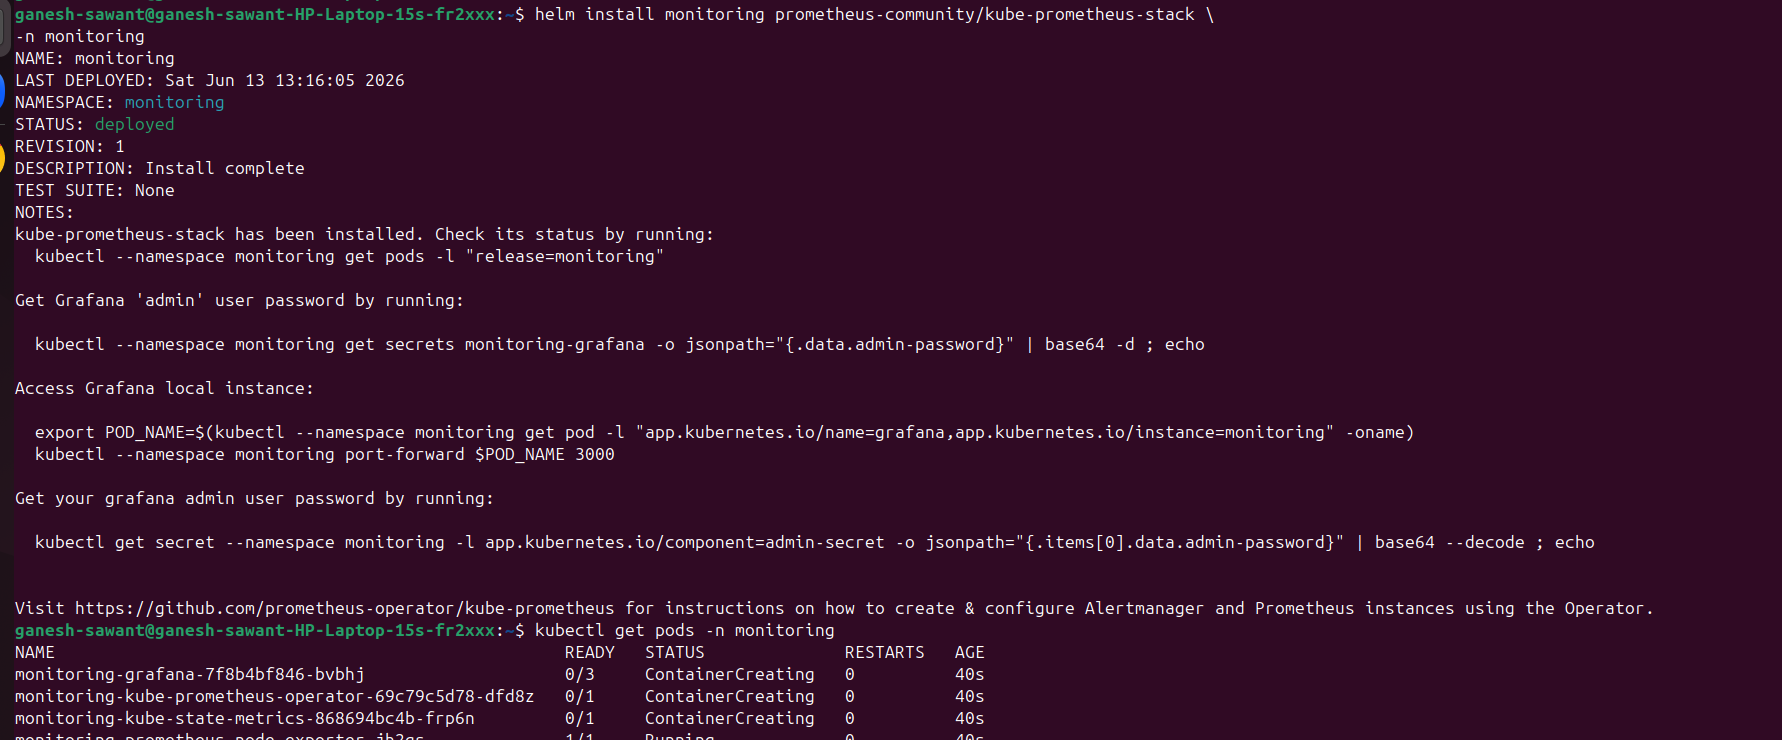
Step 3: Install Prometheus and Grafana
Install the kube-prometheus-stack package:
helm install monitoring prometheus-community/kube-prometheus-stack \
-n monitoring
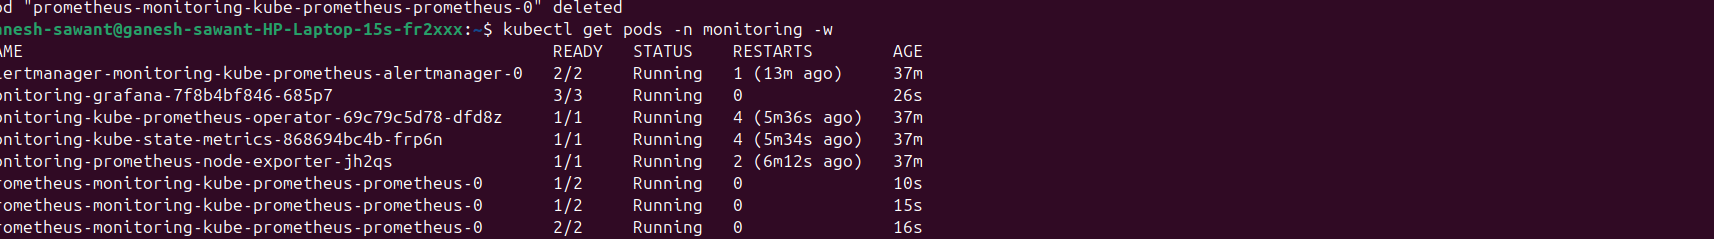
Check pods:
kubectl get pods -n monitoring
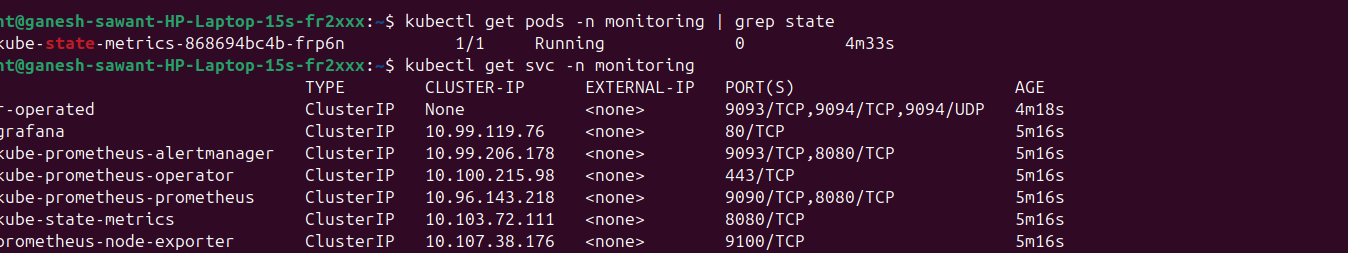
Step 4: Verify kube-state-metrics
kubectl get pods -n monitoring | grep state
Check service:
kubectl get svc -n monitoring
Step 5: Verify Node Exporter
kubectl get daemonset -n monitoring
Check pods:
kubectl get pods -n monitoring -o wide
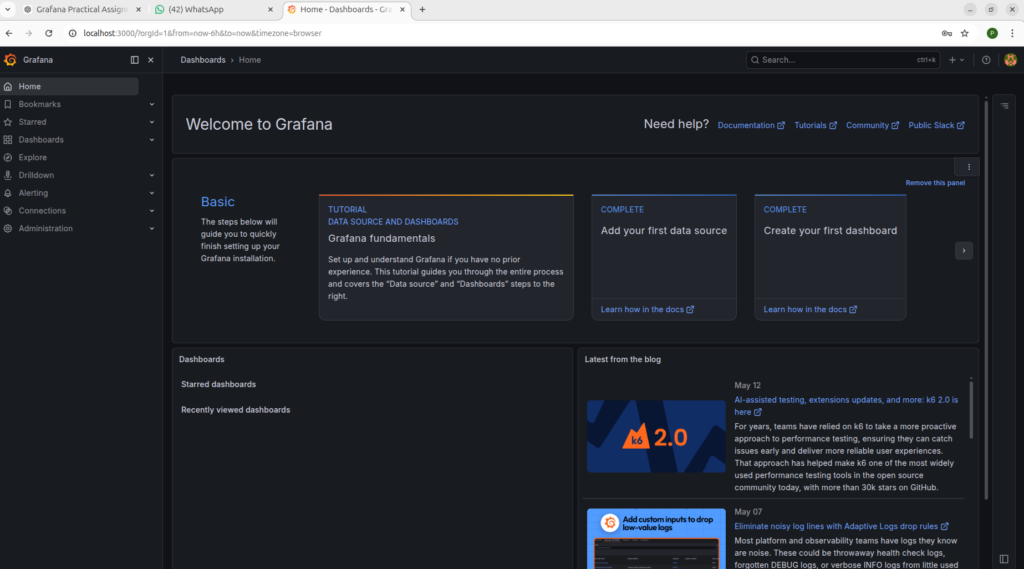
Step 6: Access Grafana
Check service:
kubectl get svc -n monitoring
Port forward:
kubectl port-forward svc/monitoring-grafana 3000:80 -n monitoring
create Grafana password:
kubectl get secret monitoring-grafana -n monitoring -o jsonpath="{.data.admin-password}" | base64 -d
echo
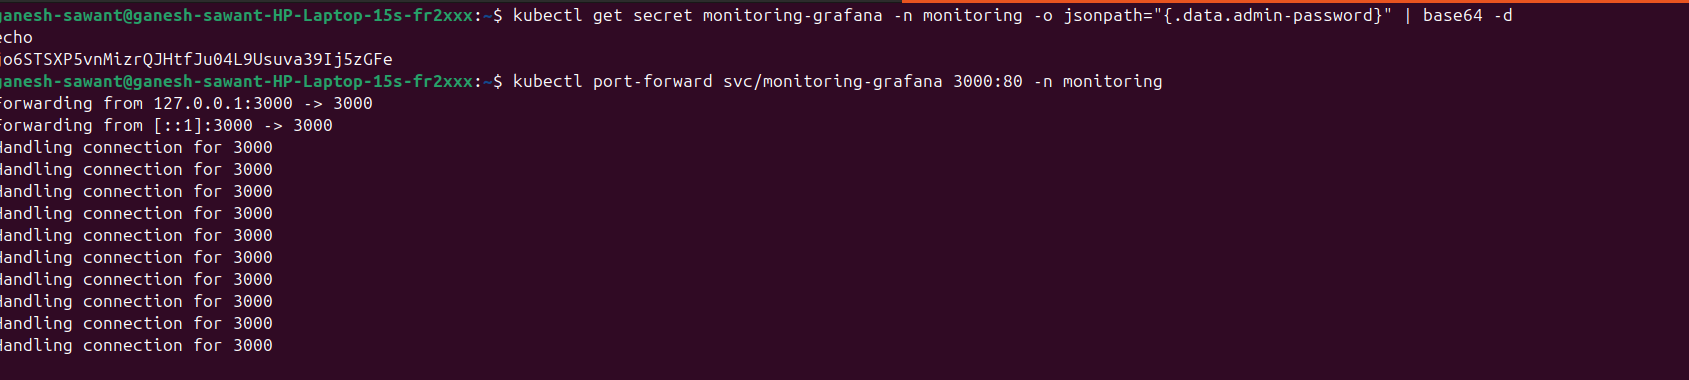
Then, open Browser,
http://localhost:3000
Login:
Username: admin
Password: (above created password)
Benefits of Kubernetes Cluster Monitoring using Grafana & Prometheus
- Monitor cluster health in real time.
- Collect metrics from nodes, pods, and containers.
- Visualize performance using Grafana dashboards.
- Configure alerts for critical events.
- Improve troubleshooting and capacity planning.
- Reduce downtime with proactive monitoring.
Best Practices for Kubernetes Cluster Monitoring using Grafana & Prometheus
Follow these best practices to build an efficient monitoring solution:
- Deploy Prometheus using Helm for easier management and upgrades.
- Secure Grafana with strong authentication and role-based access control.
- Configure alert rules for CPU, memory, disk, and pod failures.
- Store Prometheus data on persistent volumes to avoid data loss.
- Regularly update Grafana dashboards and Prometheus configurations.
- Monitor node, pod, deployment, and application metrics continuously.
- Integrate Alertmanager to receive email or Slack notifications for critical issues.
Conclusion:
Kubernetes Cluster Monitoring using Grafana & Prometheus is a powerful and reliable solution for monitoring the health, performance, and availability of Kubernetes clusters. By combining Prometheus for metrics collection and Grafana for visualization, you can gain real-time insights into CPU, memory, storage, network usage, and application performance.
In this guide, you learned how to set up Prometheus and Grafana, configure Kubernetes monitoring, and access interactive dashboards to visualize cluster metrics. Implementing Kubernetes Cluster Monitoring using Grafana & Prometheus helps DevOps teams detect issues early, troubleshoot problems quickly, optimize resource utilization, and ensure high availability of applications running in Kubernetes.
Whether you’re managing a small Kubernetes environment or a large production cluster, adopting Kubernetes Cluster Monitoring using Grafana & Prometheus is an essential best practice for maintaining a stable, secure, and efficient infrastructure.

- What is Site Reliability Engineering (SRE)? – Complete Guide - July 29, 2026
- What is Platform Engineering? A Beginner’s Guide - July 23, 2026
- Devops and Cloud Batch 12 Assignment - July 21, 2026