
Sonarqube for static code analysis
Overview
In this article, we are going to look at static source code analysis with SonarQube – an open-source platform for ensuring code quality.
Let’s start with a key question – why analyze source code in the first place? To put it very simply, to ensure quality, reliability and maintainability over the lifetime of the project; It is always more expensive to maintain a poorly written codebase.
What is SonarQube:
SonarQube is the leading tool to continuously monitor the code quality and security of your codebase and guide development teams during code reviews. SonarQube is an open source tool used for automated code review with CI/CD integration.
Read Also – Running Maven build with Jfrog Artifactory
Official website: https://www.sonarsource.com/products/sonarqube/
Installation Steps:
Prerequisite: You should have basic knowledge about Docker and basic Docker commands.
docker pull sonarqube
docker run -d --name sonarqube -p 9000:9000 -p 9092:9092 sonarqube
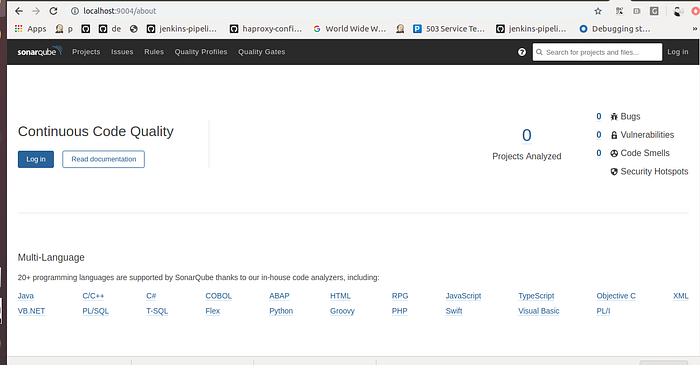
Once the above setup is complete open the following URL in the browser: http://localhost:9000
Why integrate SonarQube into CI/CD models:
Performing automated code review on every commit.
To ensure we are deploying quality code to production.
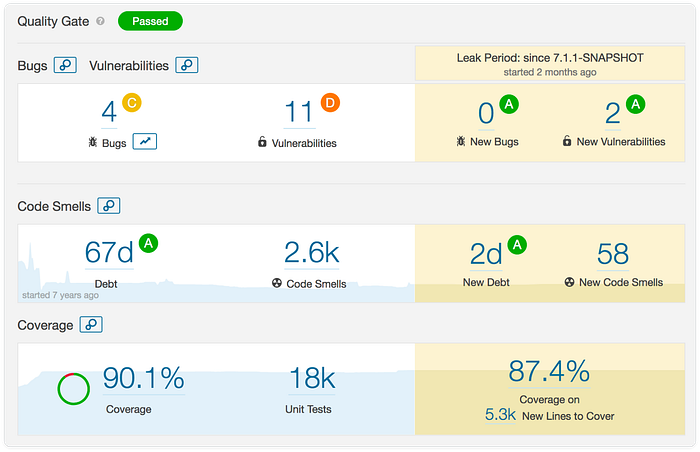
Code coverage dashboard and statistics around new code using the leak duration feature.
To reduce the challenges of manual bandwidth and reviews in the deployment cycle. Everything can be done through an automated CI/CD integration process.
Supported Languages:
SonarQube has support for over 20 languages including JS, Java, C, Spark, etc.
Maven dependencies for Java project to view code-coverage report in SonarQube dashboard:
You need to add jacoco plugin below
<properties>
<project.build.sourceEncoding>UTF-8</project.build.sourceEncoding>
<jacoco.version>0.7.9</jacoco.version>
<cxf.version>3.0.2</cxf.version>
<surefire.version>2.18.1</surefire.version>
</properties>

<! — Code Quality Plugins →

<plugin>
<groupId>org.jacoco</groupId>
<artifactId>jacoco-maven-plugin</artifactId>
<version>${jacoco.version}</version>
<configuration>
<destFile>target/jacoco.exec</destFile>
</configuration>
<executions>
<execution>
<id>pre-unit-test</id>
<goals>
<goal>prepare-agent</goal>
</goals>
</execution>
<execution>
<id>post-unit-test</id>
<phase>test</phase>
<goals>
<goal>report</goal>
</goals>
</execution>
<execution>
<id>pre-integration-test</id>
<phase>pre-integration-test</phase>
<goals>
<goal>prepare-agent</goal>
</goals>
<configuration>
<propertyName>failsafe.argLine</propertyName>
</configuration>
</execution>
<execution>
<id>post-integration-test</id>
<phase>post-integration-test</phase>
<goals>
<goal>report</goal>
</goals>
</execution>
<execution>
<id>default-check</id>
<phase>verify</phase>
<goals>
<goal>check</goal>
</goals>
<configuration>
<! — set to true to break the build on coverage violations →
<haltOnFailure>false</haltOnFailure>
<rules>
<rule implementation=”org.jacoco.maven.RuleConfiguration”>
<element>BUNDLE</element>
<limits>
<limit implementation=”org.jacoco.report.check.Limit”>
<counter>INSTRUCTION</counter>
<value>COVEREDRATIO</value>
<minimum>0.80</minimum>
</limit>
<limit implementation=”org.jacoco.report.check.Limit”>
<counter>CLASS</counter>
<value>MISSEDCOUNT</value>
<maximum>0</maximum>
</limit>
</limits>
</rule>
</rules>
</configuration>
</execution>
</executions>
</plugin>
To run Sonar analytics from a local machine, you can pass the Sonar host URL to the Maven command:
mvn sonar:sonar -Dsonar.host.url=http://localhost:9000
Benefit :
No need to track details of code quality, SonarQube has overall dashboard where we can check details of each integrated projects.
Large set of supported technologies and languages (both commercial and opensource)
Easy to install and configure, also easy integration with CI/CD models with plugins. Example: Jenkins has built-in support for Sonar integration.
We can add quality gates to failed builds based on thresholds. Example: Add quality-gate to fail, not pass 80% code coverage. So that build will automatically fail over and not be deployed to production until it has 80% code coverage.

- What is Platform Engineering? A Beginner’s Guide - July 23, 2026
- Devops and Cloud Batch 12 Assignment - July 21, 2026
- Deploy a Java Application Using Ansible | Step-by-Step Guide - July 16, 2026