

Monitoring dashboard for Jenkins memory
This article will give details on setting up the monitoring plugin to monitor Jenkins health and use cases.
Pre-requisites:
You should have basic knowledge about Jenkins, also some basic knowledge about Java memory management before installing this plugin to monitor your Jenkins setup.
Why install Monitoring Dashboard for production Jenkins setup?
Getting live debugging details about what happens with Jenkins setup internally. This will help debug Jenkins performance issues related to:
Read Also – Docker Interview Question
Java configuration.
- Memory Param.
- Slowness.
- CPU consumption.
- To check for deadlocked threads.
- User can download heap dump from UI.
- The user can download thread dumps of the application without affecting the running setup.
Details of active and logged-in users.
Here are the steps to integrate the monitoring dashboard:
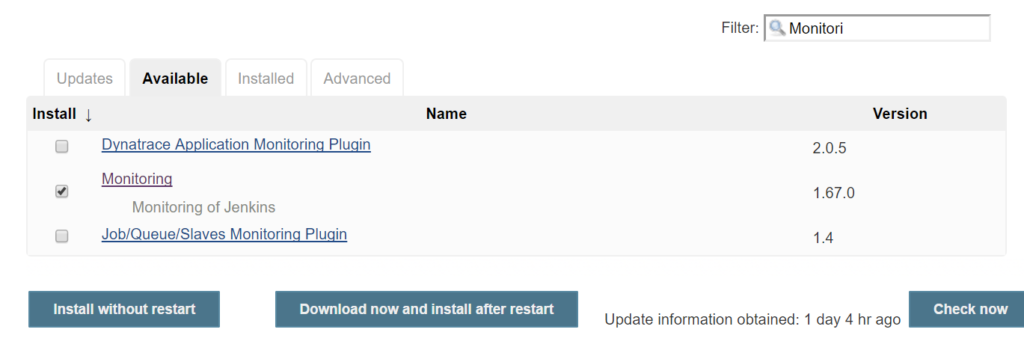
- Install monitoring plugin.
- Manage Jenkins
- Manage Plugins
- Search Monitoring Plugin
- Install Monitoring Plugin
Example :
With the help of monitoring plugin, you can see the dashboard below which is showing details of RAM, CPU, Heap memory usage, active user sessions, thread details, error logs which helps us to get run time or live debugging information for the entire setup. will help.


Monitoring groovy scripts Examples :
you can execute groovy scripts in Jenkins UI (http://localhost:8080/script)
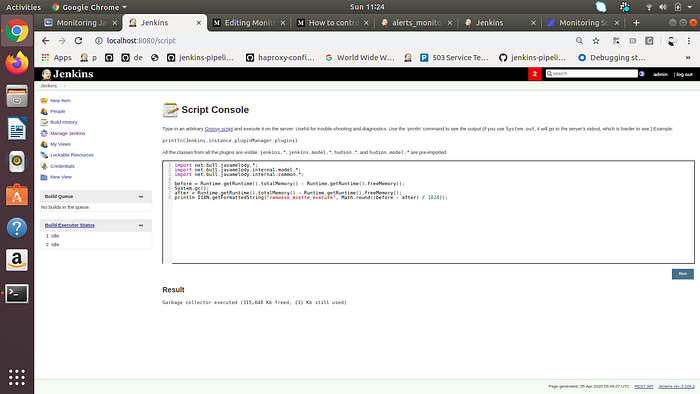
1)Execute GC manually :
import net.bull.javamelody.*;

import net.bull.javamelody.internal.model.*;

import net.bull.javamelody.internal.common.*;

before = Runtime.getRuntime().totalMemory() - Runtime.getRuntime().freeMemory();

System.gc();

after = Runtime.getRuntime().totalMemory() - Runtime.getRuntime().freeMemory();

println I18N.getFormattedString("ramasse_miette_execute", Math.round((before - after) / 1024));
2.Display some memory data
import net.bull.javamelody.*;

import net.bull.javamelody.internal.model.*;

import net.bull.javamelody.internal.common.*;

memory = new MemoryInformations();

println "\nused memory:\n " + Math.round(memory.usedMemory / 1024 / 1024) + " Mb";

println "\nmax memory:\n " + Math.round(memory.maxMemory / 1024 / 1024) + " Mb";

println "\nused perm gen:\n " + Math.round(memory.usedPermGen / 1024 / 1024) + " Mb";

println "\nmax perm gen:\n " + Math.round(memory.maxPermGen / 1024 / 1024) + " Mb";

println "\nused non heap:\n " + Math.round(memory.usedNonHeapMemory / 1024 / 1024) + " Mb";

println "\nused physical memory:\n " + Math.round(memory.usedPhysicalMemorySize / 1024 / 1024) + " Mb";

println "\nused swap space:\n " + Math.round(memory.usedSwapSpaceSize / 1024 / 1024) + " Mb";
You can also configure job and schedule cron to monitor jenkins setup by adding groovy script in job , configure mail , slack alerting based on threshold config and failure scenarios .

- What is Platform Engineering? A Beginner’s Guide - July 23, 2026
- Devops and Cloud Batch 12 Assignment - July 21, 2026
- Deploy a Java Application Using Ansible | Step-by-Step Guide - July 16, 2026