What is SonarQube? Explain in detail.
SonarQube is an open source platform for Continuous Inspection of code quality. It is written in java and supported for more than 25 languages such as Java, C/C++, C#, PHP, Flex, Groovy, JavaScript, Python, PL/SQL, COBOL, etc.
It helps for various tasks and provide reports on duplicated code, coding standards, unit tests, code coverage, complex code, potential bugs.
SonarQube Features:
Supports Languages:
Can also be used in Android development.
Offers reports on duplicated code, coding standards, unit tests, code
coverage, code complexity, potential bugs, comments, design, and architecture.
Records metrics history and provides evolution graphs (“time machines”) and differential views.
Integrates with the Eclipse development environment
Is expandable with the use of plugins.
Implements the SQALE methodology to compute technical debt.
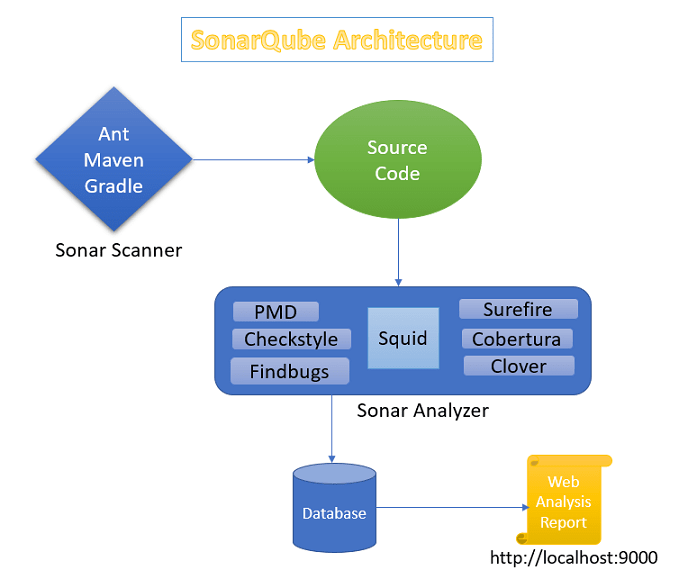
Architecture of Sonarqube:
Code using java:
SonarQube is an open source platform for ongoing software quality inspection. SonarQube has support for different languages like Java, PHP, Flex, Ruby. It gives you code coverage information, so it basically tells you what percentage of your code is actually covered by test cases.
Once you run the sonarqube, the developer or manager will be able to take action to resolve or fix these issues based on that report. After fixing the issues, the report will be executed again and the current results will be compared to the historical report.
It supports build tools or integration tools.It is possible to integrate SonarQube with tools like Ant, Maven, Gradle.
The developer can integrate the SonarLint plugin with Eclipse so that the developer can analyze the code quality at the same time as the development phase.
Read Also-How To Setup Jenkins On Kubernetes Cluster
SonarQube Architecture:

1.Sonar Scanner:
The parameter is used to set the location from where you want to take the source code. SonarQube supports plugins like Cube SVN and some other version control systems like Git etc. You can go straight ahead and include these things with any build tools that have integration tools, so you don’t need to provide direction every time, as the build tool automatically pulls the software from the database. .
2. Source Code:
The code is then pushed to repository.
Source code is code written by a developer or manager.
Pull Requests (PRs) are visible in SonarQube
3 . Sonar Analyzer:
Sonar analyzer takes the source code and goes through all the code and gives you the technical problems
Sonar receives the request and starts to examine the source code of the project. The analysis is based on the project’s Sonar profile activating any additional plugins or reporting capabilities, if any.
You need to add these plugins to the sonar analyzer based on the language you want to analyze.
When the analysis is finished, the results will be stored in the database for future reference.
4. SonarQube Database:
Once the report is generated it will be sent to the database so that it can be stored in the database and used later for reporting purposes.
Once Sonar Analyst completes the analysis of the source code it will send this report to the queue. where the server needs to process those results
You can integrate your own database our to your sonarqube
Hope you like this blog….
- AI Tools for Developers: Top AI Tools Every Developer Should Know in 2026 - February 12, 2026
- What is AI? 7 Powerful and Easy Facts – Complete Beginner Guide - February 12, 2026
- How to Set Up an Okta Account – Easy & Secure Step-by-Step Guide for 2026 - January 9, 2026

