What is Grafana?
Grafana is a popular open-source platform for monitoring and observability, widely used for visualizing metrics, logs, and other time-series data. It provides powerful tools for creating interactive and customizable dashboards, enabling users to gain insights from their data in real-time. Grafana supports real-time monitoring through customizable dashboards, providing insights into metrics stored across various sources. With a wide range of visualization options, including graphs and charts, Grafana empowers users to create visually appealing and informative dashboards.
Overview
Grafana is an open source interactive data-visualization platform, developed by Grafana Labs, which allows users to see their data via charts and graphs that are unified into one dashboard (or multiple dashboards!) for easier interpretation and understanding. You can also query and set alerts on your information and metrics from wherever that information is stored, whether that’s traditional server environments, Kubernetes clusters, or various cloud services, etc. You’re then more easily able to analyze the data, identify trends and inconsistencies, and ultimately make your processes more efficient. Grafana was built on open principles and the belief that data should be accessible throughout an organization, not just to a small handful of people. This fosters a culture where data can be easily found and used by anyone who needs it, empowering teams to be more open, innovative, and collaborative.
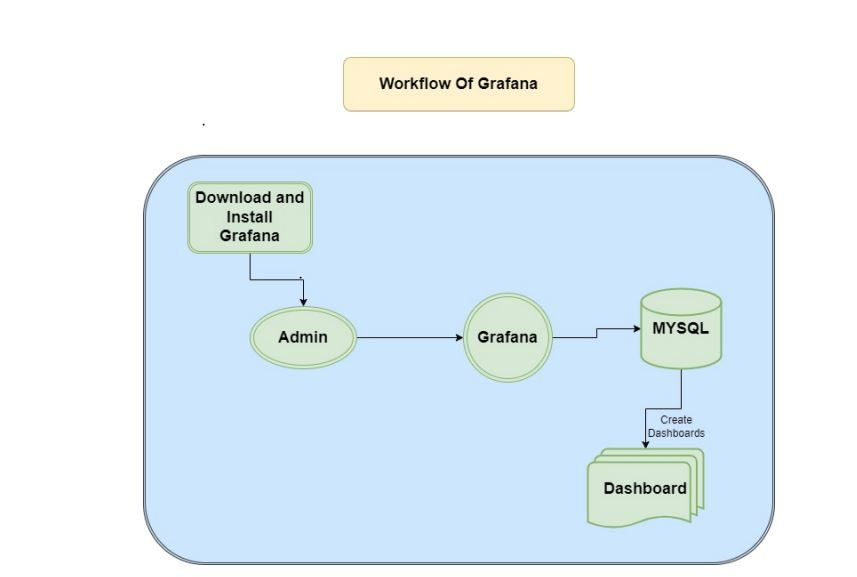
Workflow of Grafana
What is Grafana Architecture?
Understanding Grafana architecture is important to become an expert in this platform. It has a multi-component architecture encompassing Mimir, Loki, Agent and the LGTM stack. This brief introduction to each is enough for a quick look at what each of these components do.
- Grafana Mimir– It is a microservices-based system with many different components that run parallelly. All the codes of these components are compiled into a single binary.
- Grafana Loki– It is a microservices-based system that can easily be run as a distributed system. All the codes of these components are compiled into a singular binary/ Docker image.
- Grafana Agent Operator– This component of the architecture watches for Kubernetes custom resources. It specifies the ways for collecting telemetry data from any given Kubernetes cluster.
- LGTM Stack– It’s an observability stack that encompasses Loki, Grafana, Tempo and Mimir (LGTM) . This stack is focused on the three pillars of observability – logs, metrics and traces.
Key Features of Grafana
- Custom Dashboards: Easily build and customize dashboards using drag-and-drop panels.
- Multiple Data Sources: Integrates with databases and tools like Prometheus, InfluxDB, MySQL, PostgreSQL, Elasticsearch, Loki, and more.
- Powerful Querying: Use flexible query editors that support SQL, PromQL, and other query languages.
- Alerting System: Configure threshold-based alerts and get notified via email, Slack, Microsoft Teams, PagerDuty, and more.
- Authentication & Security: Supports OAuth, LDAP, SAML, and role-based access control (RBAC).
- Plugins & Extensions: Extend functionality with a large ecosystem of plugins for panels, data sources, and apps.
How Grafana Works
Grafana connects to various data sources and allows you to visualize metrics, logs, and traces in customizable dashboards.
Each dashboard consists of one or more panels (e.g., graphs, heatmaps, tables, text). These panels are backed by queries written in the respective query language of the data source.
Grafana doesn’t store the data itself (except for user data and dashboards); it fetches it from the connected data sources.
Dashboards
Grafana’s dashboards give a new level of meaning to data collected from various sources. Those dashboards can then be shared with other team members and other teams, allowing collaboration and more extensive exploration of the data and its implications. Build dashboards specifically for you and your team and customize your panels to create the visualizations you want, using advanced querying and transformation capabilities.
Understanding all relevant data and data relationships is vital when trying to find the cause for an incident or unexpected system behavior as quickly as possible. Grafana allows for seamless visualization and movement of data between teams and team members so that they can get to the root of a problem quickly and solve it.
Insights from Grafana dashboards can be shared:
- Across a company—even to coworkers who aren’t Grafana users themselves.
- Across the Grafana community, anywhere in the world
- Wherever you go: you can see your dashboards on all of your devices wherever you are.
Key features
- Panels: visualize your data any way you want using histograms, graphs, geomaps, heatmaps, etc.
- Plugins: Render your data in real time on a user-friendly API via panel plugins that hook into existing data sources—no data migration required. You can also create data source plugins, retrieving metrics from any custom API.
- Alerts: One user interface lets you create, consolidate, and control all your alerts.
- Transformations: Rename, summarize, combine, and perform calculations across data sources and queries.
- Annotations: Use rich events from different data sources to annotate graphs.
- Panel Editor: A consistent user interface for configuring and customizing your panels.
The Purpose of Grafana Dashboards
These dashboards have a specific fundamental purpose to serve in relation to data visualization and analysis. These versatile and dynamic dashboards are designed for the following things –
- Centralize Data– These work like centralized hubs to consolidate data from a myriad of sources. This can easily access and analyze information.
- Real-time Monitoring– Real-time monitoring of important services and systems is promoted for a complete view of performance metrics. It prompts issue identification as well as resolution.
- Visualize Data– Complicated datasets are transformed into easy-to-understand visual representations like charts, tables and graphs.
- Performance Analysis– They dissect the performance of applications, networks and servers. Latency, bottlenecks as well as other performance-related trends are identified.
- Historical Analysis– They analyze historical data trends for better steps and even predicting future behavior.
Dashboard Features
Gaining information about Dashboard features can lead to career growth. This is vital knowledge for optimally using the dashboard for different purposes.
1. Dashboard Templating
Dashboard templating creates many reusable dashboards for different use cases. The values with these templates aren’t hard-coded. It is possible to use the same dashboard for both test server and production server. Templating lets the user drill down into the data from a huge space. These dashboards can also be shared across teams within the company. It’s possible to contribute it to the community for customization and usage if a great dashboard template is created.
2. Provisioning
It is already easy to click, drag and drop for the creation of a single dashboard. Power users needing many dashboards might still want to automate the setup using a script. Anything can be scripted on this platform.
3. Permissions and Teams
Companies having one Grafana and many teams can keep things separate while sharing dashboards. This platform has introduced multi-tenant mode wherein it’s possible to switch organizations without sharing dashboards. Now a team of users can be created and permissions be set on dashboards, folders and down to the data source level.
4. Authentication
Different authentication styles are supported and include OAuth and LDAP for mapping users to companies. Users can be mapped to teams in Grafana Enterprise if the company has its own authentication system. The teams can be mapped in the internal systems to teams in Grafana to give people automatic access to the dashboards outlined for their teams.

- AI Tools for Developers: Top AI Tools Every Developer Should Know in 2026 - February 12, 2026
- What is AI? 7 Powerful and Easy Facts – Complete Beginner Guide - February 12, 2026
- How to Set Up an Okta Account – Easy & Secure Step-by-Step Guide for 2026 - January 9, 2026