

Network Troubleshooting Commands
Any computer connected to the network must be able to process the communication protocol. This requirement has the advantage of offering query commands that give live feedback on the various utilities that operate the network. The commands that launch those interrogators provide very useful information for network troubleshooting.
This guide to network troubleshooting commands includes several utilities you probably already know about. However, this guide is intended to provide information on how to get the best out of these free features.
Although network monitoring tools provide better automation, using free network commands helps the network administrator understand how the network operates.
You will find out about:
- Ping
- Telnet
- TraceRoute
- ARP
- IPConfig/IFConfig
- Netstat
Ping
Ping exploits a feature in the Internet Control Message Protocol. ICMP was specified to provide status feedback on connections and packet transmissions. Ping uses these confirmation messages to measure the roundtrip time (RTT) on the path to a target.
The utility sends a small packet to a given address and waits for a response from the target computer. By default, the device may also detect that a destination is unreachable – if no response comes, there is a problem. This tool sends a series of test packets, which are ICMP echo requests.
The ping command is available in all operating systems and it behaves in almost the same way for all versions. The command requires a destination IP address to launch. to You can give a domain name instead, so that ping will check on the DNS system that you are using. This is because the command first has to go to the destination IP address and retrieve it.
The format of the command varies slightly depending on the operating system running it. However, the options on a command can be written in any order and the target address can appear anywhere after the command name.
Ping on Windows
On Windows, the ping utility sends four requests by default which can be changed via a switch in the command. Each packet contains 32 bytes of data. Switches or options on a utility are preceded by a minus sign (“-“).The only parameter for the command is the target name, which can be an IP address or a domain name.If the device being tested as a destination is on the local network, the target name can be the hostname of that device.Important options to try are:
?Gives the list of optionsaResolve the IP address given to a hostname before sending echo requestsi <number>Maximum number of hops to cross when replying (TTL)l <number>Size of data payloadn <number>Number of requests to sendtContinuous request issued until the user specifies to stop with Control-Cw <number>Timeout in milliseconds to wait for a response
Read Also-Introduction to AWS Simple Storage Service (AWS S3)
Ping on Windows Server
There are some differences between the implementation of ping on Windows and Windows Server. On Windows Server, the character preceding each option is a slash (“/”).For example, the command to get a list of options on Windows Server is ping /h instead of ping -h. The list of options for Windows Server is smaller than for Windows Edition. The -c (routing compartment identifier) and -p (pinging Hyper-V server) options are not present in Windows Server editions.
Ping on Linux
Ping is included in the iputils package.However, you probably won’t need to install it as it comes pre-loaded in almost all Linux distros. The main difference between ping on Linux and ping on Windows is that the data payload on a Linux ping request packet is 56 bytes long. The results report shows the total packet size including header length – on a packet with a 56-byte payload this will be 64 bytes.
The default status of Ping on Linux is the interactive mode, which a user on a Windows system would need to use the -t option. The utility will continue to send echo requests until the user types Control-C. At that time, the feature generates a summary report for the number of requests that were successfully completed.
Options are indicated by a minus sign (“-”), as with the Windows implementation. The Linux version of Ping has more options than the Windows version and the two implementations use different codes for the same options.
Here are some key options in the Linux Ping implementation.
aAudible Ping Makes a beeping noise when a response is received.bPing to a broadcast addressc <number>Number of requests to sendi <number>The number of seconds to wait before sending each request in the seriesl <number>Send the specified number of packets without waiting for a responsenNumeric output onlyt <number>Maximum number of hops to cross when replying (TTL)w <number>Length of time until the Ping execution terminatesW <number>Timeout in milliseconds to wait for a response
Ping on macOS
Macs have a built-in ping utility in the graphical user interface. This can be found in the Network Utility screen, which you can access through Apple Menu > About this Mac > System Report > Window.
The ping command is also available in a terminal session. This is very similar to the implementation found in Linux. However, some of the options are different.
aAudible Ping Makes a beeping noise when a response is receivedAAudible Ping with a beep when the wait for response times outb <interface>Bind the socket to the specified interfacec <number>Number of requests to sendCProhibit the socket from using a cellular network interfacei <number>The number of seconds to wait before sending each request in the seriesl <number>Send the specified number of packets without waiting for a responseLSuppress loopback of multicast packetsm <number>Maximum number of hops to cross on outbound request (TTL)nNumeric output onlyt <number>Length of time until the Ping execution terminatesT <number>Maximum number of hops to cross for a multicast packet (TTL)W <number>Timeout in milliseconds to wait for a response
Ping output
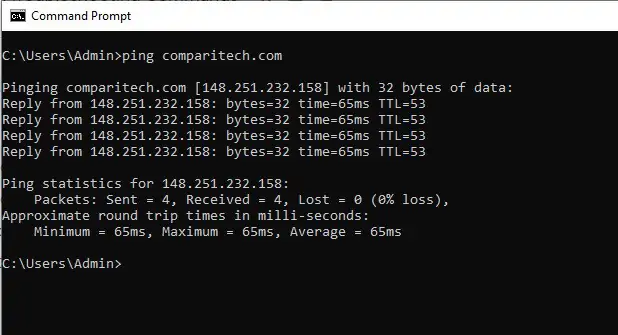
The results of the echo requests are shown with the RTT for each request expressed in milliseconds (ms) and a summary of statistics for the batch. While the Windows version shows the RTT of each received response in whole milliseconds, the Linux version shows the time in milliseconds to three decimal places. The other difference in the result record is that the Linux version shows a sequence number, called icmp_seq.
On Windows, the summary gives the minimum, maximum, and average speed of requests in the batch, which is an essential metric for assessing jitter. It also gives the total number of packets sent and received, as well as the number of packets lost and the percentage of packet loss.
The summary report on Linux and macOS shows the mean deviation of all the test requests as well as the minimum, maximum, and average RTT.
The output for the summary is different according to the computer that is contacted. Some computers respond with IPv6 addresses. You can force IPv4 addresses only by specifying the option -4 in the command (/4 in Windows Server).
An IPv6 response does not include a TTL value. The TTL report on each line gives the remaining TTL on the received packet. This enables you to work out the number of nodes the response crossed by deducting the TTL figure in the results from the original TTL on the packet. Different operating systems use different TTL starting points.
- Routers: 255
- Windows: 128
- Linux: 64
- macOS: 64
By looking at the TTL number, you can work out the OS of the remote computer. For example, if the TTL on a response is 54, it is unlikely that the response passed through 74 routers, so you can deduce that the remote computer is running Linux or macOS.
Telnet
Ping works at the Network level. It doesn’t recognize the Session Layer concept of ports. However, Telnet is able to work with ports, so this is the easiest utility to use for a quick check on specific ports. Telnet is a remote terminal protocol and it is one of the oldest TCP/IP protocols. You don’t need to log into a remote computer in order to test whether a port is open with Telnet.
Telnet on Windows and Windows Server
Although Telnet is bundled into Windows, it isn’t instantly available – you have to enable it.
- Search for the Control Panel in the Start bar search field.
- Click on the Control Panel icon in the search results screen.
- Select to show Large Icons in the Control Panel window.
- Click on Programs and Features.
- Click on Turn Windows features on or off. A popup window will appear.
- Scroll down in the list of features and check the Telnet Client box.
- Click OK and wait for the installer to complete.
Telnet on Linux
Telnet is free but not always available on all distros of Linux. If you get the message “command not found,” issue the command:
sudo apt-get install telnet
Telnet on macOS
Telnet is not automatically available on macOS. However, it is possible to install it. First, in a Terminal session, install Homebrew:
/usr/bin/ruby -e "$(curl -fsSL https://raw.githubusercontent.com/Homebrew/install/master/install)"
Next, install Telnet:
brew install telnet
Check port availability with Telnet
Once you have Telnet working on your computer, you just need to run the telnet command giving the IP address of the computer you want to check followed by the number of the port that you want to check. For example:
telnet 216.58.211.46 80
Telnet will also accept a domain name instead of an IP address. If the screen goes blank, the port is open and contactable. Press Control-] to get out of the Telnet environment. If the computer is not contactable or if it is available but the nominated port is not open, you will get the message “Could not open a connection to the host.”
TraceRoute
TraceRoute is the second most important network troubleshooting command after Ping. Both utilities are derived from the same source: the Internet Control Message Protocol. Ping tells you whether the destination computer is contactable or not. The response from the target computer also confirms that the route to that computer is working. TraceRoute reports back on each router in the path to a given destination.
Traceroute does a lot more work than ping and therefore takes longer to run. Essentially, a traceroute is a ping to every router in the path to a given destination.
The Time to Live (TTL) field in the packet header determines the maximum number of hops that the packet can pass through to reach its destination. Each router that handles the packet decrements the TTL value by 1. If the resulting number is zero, the router does not forward the packet, but reports back to the source of the packet that the transmission has been terminated. Traceroute uses this report to compile records of the router’s IP addresses and RTTs for transactions. To each router in the path, traceroute will send three packets.
When traceroute receives responses from its three tests for the first router on the path, it sends another packet to the target computer but with TTL.When TraceRoute receives back responses from its three tests to the first router on the path, it sends out another packet to the target computer but with a TTL of 2. This packet gets past the first router and reaches the second. The test is performed three times and then repeated with a TTL of 3 so that it reaches the next router in the path. This cycle of increasing the TTL by one for each pass ultimately gets the packet to the computer that was given as the target for transmission. When this happens, traceroute reports the RTT for that address for three trials and then terminates.RTT figures are shown in milliseconds (ms).
Unlike ping, traceroute does not provide any performance summaries on each row or overall. The command can be launched with either an IP address or a domain name for the final destination. Giving a domain name also tests the domain name system used by the source computer.Domain naming also tests the domain name system used by the source computer.
The tests for each router in the path are run from the standing start – they do not show incremental results. Thus, it is possible that the further the test reaches, the longer the RTT will be. However, it is possible that the RTT for subsequent routers may be lower than the speed recorded by nearby routers in the route.
TraceRoute on Windows and Windows Server
On both Windows and Windows Server, the traceroute command is the same: tracert. This requires a destination address, which can be an IP address or a domain name. There are a small number of options with the utility and the Windows version has more available options (nine) than the Windows Server implementation (seven). Options are prefixed by a minus sign (”-”). The command can be run without any options. If there are options on the command line, they must all be written before the destination address.
Some important options are:
?HelpdDo not resolve addresses to hostnameshMaximum number of hopswTimeout for each test (in milliseconds)4Use IPv4 addresses (not available in Windows Server)6Use IPv6 addresses (not available in Windows Server)
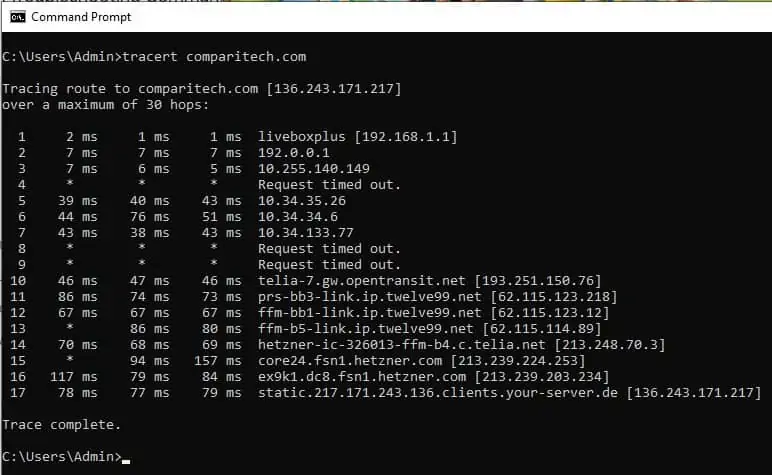
Each results line shows the test number, the three test results in whole milliseconds, and then the destination hostname and address. Failed tests are represented by an asterisk (“*”).
TraceRoute on Linux and macOS
TraceRoute is available on macOS and Fedora Linux but not on Ubuntu or Manjaro. To install the command on Ubuntu, type:
sudo apt-get install traceroute
On Manjaro, type:
sudo pacman -Sy traceroute
The TraceRoute command in Linux and macOS is traceroute and it takes a destination address either as an IP address or as a domain name. All options come between the command and the destination address, which can be an IP address or a domain name. There is one option, packetlength, which appears after the destination address as a whole number without a label.
Apart from packetlength, the Linux version has 26 options and the macOS version has 25. Here are some of the most important.
helpHelpdEnable socket-level debuggingmMaximum number of hopsq <number>Number of tests per hopwTimeout for each test (in milliseconds)4Use IPv4 addresses (not available in macOS)6Use IPv6 addresses (not available in macOS)
Each result line shows the test number, destination hostname and IP address, and then all tests for that hop expressed in milliseconds to three decimal places on Linux or whole numbers on macOS. As with the Windows version, failed tests are represented by an asterisk (“*”).
ARP
ARP stands for the Address Resolution Protocol. It maintains the mapping between the IP address and the physical, or MAC, address of the corresponding host. This service is used for devices connected to your own network rather than for checking remote devices over the Internet. ARP also includes options to insert or update records in the ARP table and a query tool. All of these utilities have the same command: arp.
On Windows, Windows Server, and macOS, the command to get a list of all address mappings on the network is arp -a. On Linux, the command is arp.If you only want to see ARP details for a specific device, you can enter its IP address at the end of the command – like this:
arp -a 192.168.1.1
The output of the arp query will also tell you whether the IP address is static (which means it is fixed) or dynamic (which means it is reallocated periodically through DHCP).
ARP
ARP stands for the Address Resolution Protocol. It maintains a mapping between IP addresses and the physical, or MAC, addresses of the related host. This service is used for the devices attached to your own network rather than to examine remote devices across the internet. ARP includes options to insert or update records into the ARP table and also a query tool. All of these utilities have the same command: arp.
On Windows, Windows Server, and macOS, the command to get a list of all address mappings on the network is arp -a. On Linux, the command is arp. If you only want to see the ARP details for one specific device, you can enter its IP address at the end of the command – such as:
arp -a 192.168.1.1
The output of the arp query will also tell you whether the IP address is static (which means it is fixed) or dynamic (which means it is reallocated periodically through DHCP).
IPConfig/IFConfig
PCConfig and IFConfig manage the IP address allocation of a host. They give you the address details of each network interface of the computer on which you issue the command. Although it pertains to a single computer, some of the details provided by the utility relate to the network or subnet to which the computer belongs.
The command to query IP address settings on computers running Windows, Windows Server, and macOS is ipconfig.
The command will show you which network interfaces on the computer are active, give the MAC address and IP address of the computer and also give the subnet mask and gateway IP address.
Netstat
Netstat shows all open connections and active daemons on a computer., This is a useful tool if you want to check on a server whether an expected service is actually running. In that scenario, you would need to log into the server and run the commands on that computer.
The command for Netstat on Windows, Windows Server, Linux, and macOS is the same: netstat.
There are many options available for the command and they are different per operating system. Fortunately, the three most important options that are the only ones you are ever likely to use are the same on all four key operating systems. These are:
aInclude server ports in the output, which are not included in the default outputnShow port numbers and does not translate to names or associated protocolsoShow active TCP connections with the process ID for each (not available on macOS)
Options can be combined, so it isn’t necessary to separate them and put a minus sign in front of each. The results show a long list, so it is better to pipe the output to a paging utility. Eg:
netstat -an | more
On Macs, the Netstat utility is also available on the Network Utility screen. You reach this feature through Apple Menu > About this Mac > System Report > Window.
Network troubleshooting FAQs
What are the 7 troubleshooting steps?
The seven steps of troubleshooting are:
- Identify the problem
- Establish a theory of the cause
- Test the theory
- Create a resolution plan
- Implement the plan
- Verify the new system
- Document the solution
What are the common network problems?
Common network problems are those issues that arise frequently and should be planned for. Although good administration should prevent many of these problems from arising, they will still occur from time to time. Consider:
- Bandwidth capacity on each interface on each network device
- Device availability
- CPU capacity per device
- Loose cable connectors
- Malfunctioning ports
- IP address distribution problems
- DNS server errors
Hope you like this blog….

- AI Tools for Developers: Top AI Tools Every Developer Should Know in 2026 - February 12, 2026
- What is AI? 7 Powerful and Easy Facts – Complete Beginner Guide - February 12, 2026
- How to Set Up an Okta Account – Easy & Secure Step-by-Step Guide for 2026 - January 9, 2026