


Setup grafana monitoring with promethus on ubuntu linux
Grafana is a powerful open-source platform used for monitoring and visualizing time-series data. In this guide, we’ll walk through how to install and set up Grafana on an Ubuntu system (20.04/22.04 LTS).
Prerequisites
- Ubuntu 20.04 or 22.04 (64-bit)
- A user with
sudoprivileges - Internet access
✅ Install Prometheus
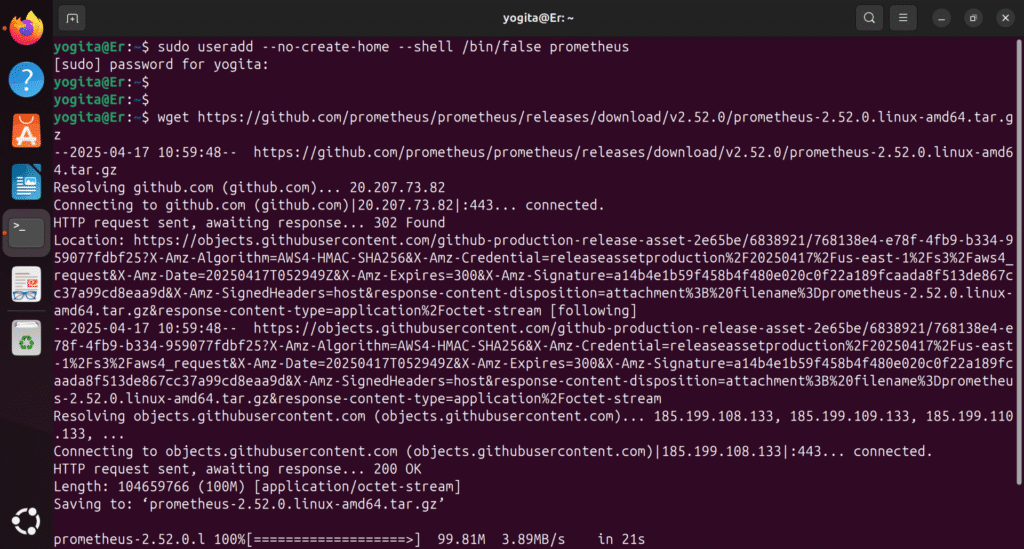
1️⃣ Create a Prometheus User
sudo useradd --no-create-home --shell /bin/false prometheus
2️⃣ Download Prometheus
Get the latest version from https://prometheus.io/download/
wget https://github.com/prometheus/prometheus/releases/download/v2.52.0/prometheus-2.52.0.linux-amd64.tar.gz
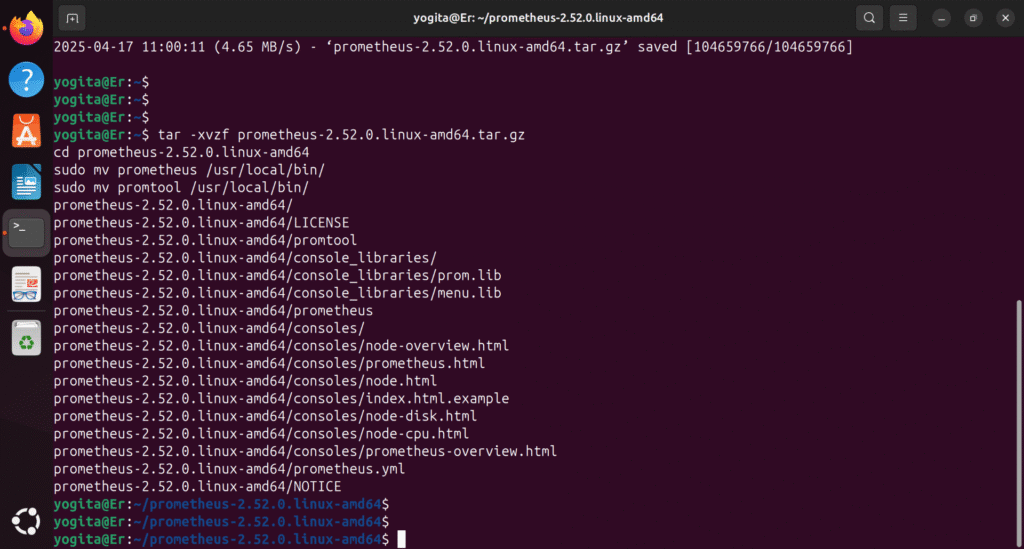
3️⃣ Extract & Move Binaries
tar -xvzf prometheus-2.52.0.linux-amd64.tar.gz

cd prometheus-2.52.0.linux-amd64

sudo mv prometheus /usr/local/bin/

sudo mv promtool /usr/local/bin/
4️⃣ Move Configuration & Setup Directories
sudo mkdir /etc/prometheus

sudo mkdir /var/lib/prometheus

sudo mv consoles /etc/prometheus

sudo mv console_libraries /etc/prometheus

sudo mv prometheus.yml /etc/prometheus
5️⃣ Set Ownership
sudo chown -R prometheus:prometheus /etc/prometheus /var/lib/prometheus

6️⃣ Create Prometheus Systemd Service
sudo nano /etc/systemd/system/prometheus.service

[Unit]

Description=Prometheus Monitoring

Wants=network-online.target

After=network-online.target

[Service]

User=prometheus

ExecStart=/usr/local/bin/prometheus \

--config.file=/etc/prometheus/prometheus.yml \

--storage.tsdb.path=/var/lib/prometheus/ \

--web.console.templates=/etc/prometheus/consoles \

--web.console.libraries=/etc/prometheus/console_libraries

[Install]

WantedBy=multi-user.target

7️⃣ Start & Enable Prometheus
sudo systemctl daemon-reload

sudo systemctl start prometheus

sudo systemctl enable prometheus

Check status:
sudo systemctl status prometheus
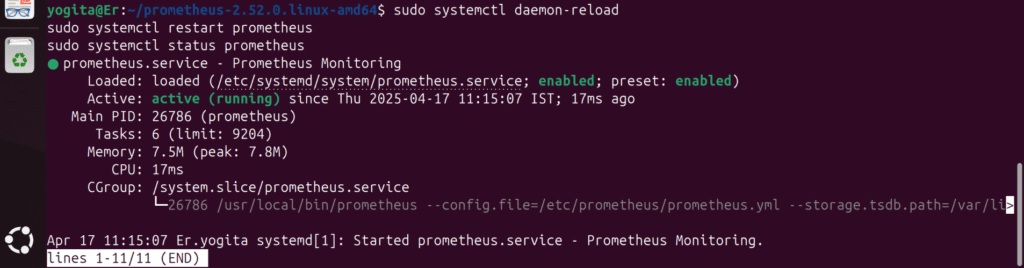
Access at: http://your-server-ip:9090
✅ Install Grafana
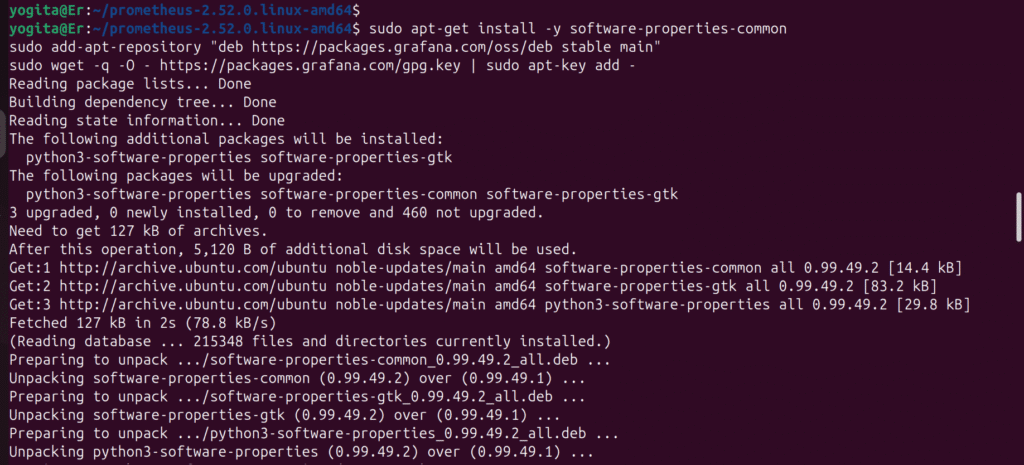
1️⃣ Add Grafana APT Repo
sudo apt-get install -y software-properties-common

sudo add-apt-repository "deb https://packages.grafana.com/oss/deb stable main"

sudo wget -q -O - https://packages.grafana.com/gpg.key | sudo apt-key add -
2️⃣ Install Grafana
sudo apt-get update

sudo apt-get install grafana
3️⃣ Start & Enable Grafana
sudo systemctl start grafana-server

sudo systemctl enable grafana-server

Access at: http://your-server-ip:3000
✅Go to http://your-server-ip:3000
- Login with
admin/admin - Go to Configuration → Data Sources → Add data source
- Choose Prometheus
- Set URL to
http://localhost:9090 - Click Save & Test
Connect Prometheus to Grafana
Access the Grafana web UI by visiting http://localhost:3000 in your web browser.
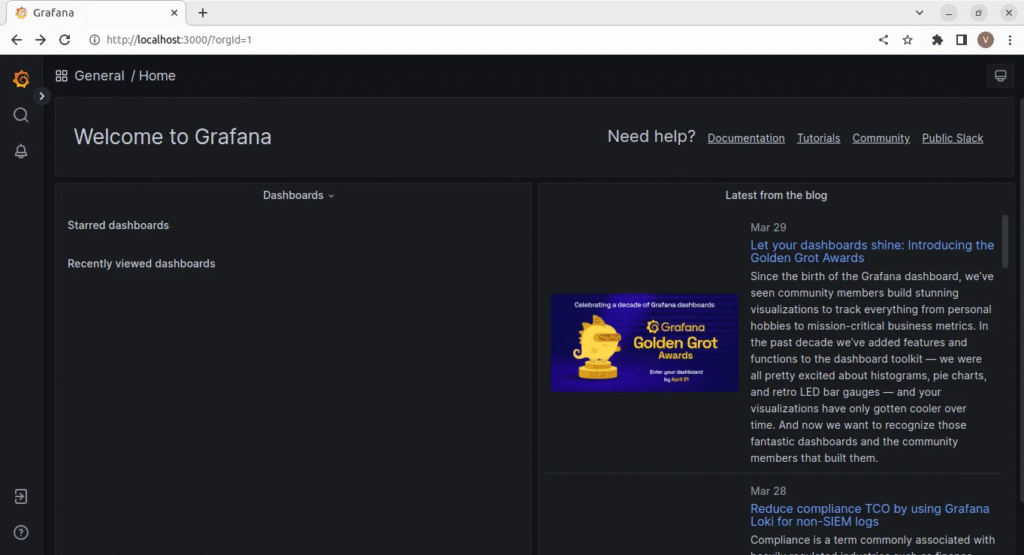
2. Log in to Grafana with the default credentials (username: admin, password: admin).
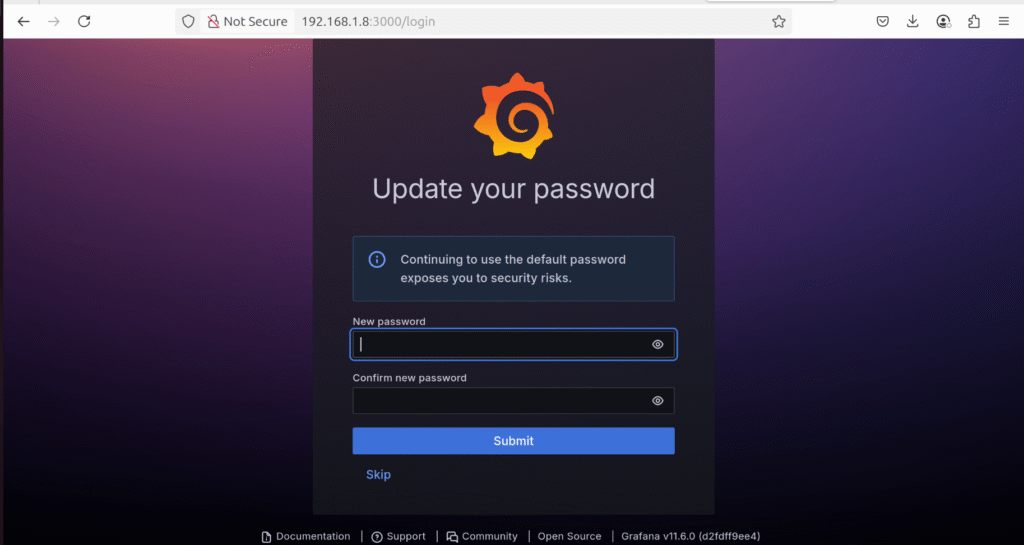
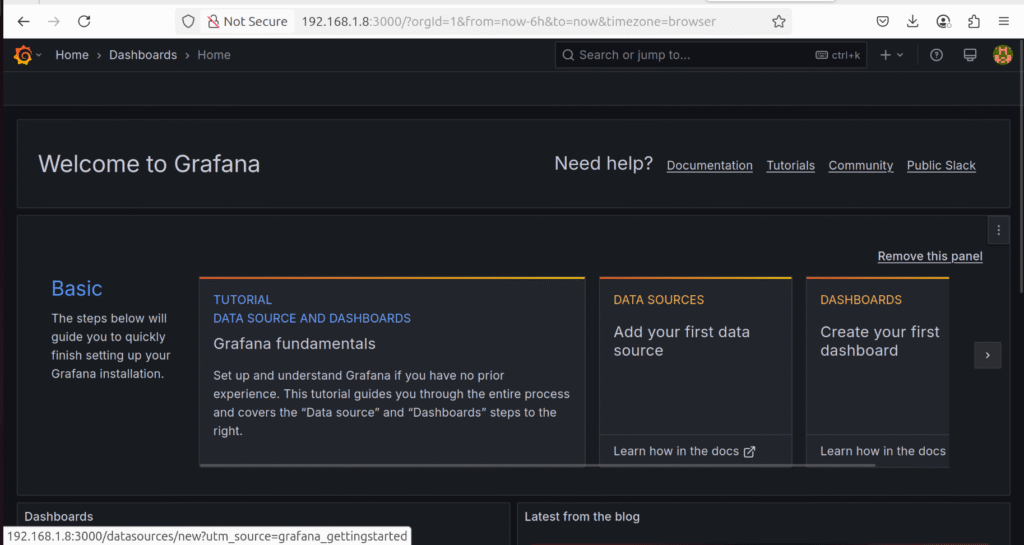
3. You should see the Grafana password change screen. Change your default password and click on the Submit button. You should see the Grafana dashboard on the following screen:
ConclusionIn this post, You have now installed and set up Grafana on Ubuntu. You can start exploring its features and creating your own dashboards to visualize your data.

- AI Tools for Developers: Top AI Tools Every Developer Should Know in 2026 - February 12, 2026
- What is AI? 7 Powerful and Easy Facts – Complete Beginner Guide - February 12, 2026
- How to Set Up an Okta Account – Easy & Secure Step-by-Step Guide for 2026 - January 9, 2026